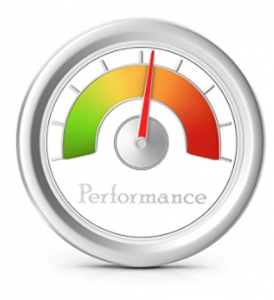
OEE
OEE (Overall Equipment Rate) is the most widely used indicator in the context of a LEAN approach. Following the detailed activity of a workstation, it allows us to separate the time with value added from the time with non value added.
It allows to identify waste, classifying them in order to plan actions for improvement.
The composition of OEE
OEE measures the performance of an equipment depending on 3 components:
 The availability of equipment
Ar = (Planned production time- stop loss) / Planned production time
 The equipment performance
Pr = (Theoretical cycle time x total amount of parts) / Performing time
 The quality provided by the equipment
Qr = (Parts total amount – scraps amount) / Parts total amount
OEE = Ar x Pr x Qr
Example :
- Equipment has a 7:00 planned production time.
- The recorded stops (failure, setting, material supply, …) are 40 minute.
- The theoretical cycle time is 125 pieces / hour, but the actual time is 110 pieces / hour.
- The total amount of manufactured parts is 695. Of the total, 45 pieces are rejects.
- Ar = (420 – 40) / 420 = 90.5%
- Pr = (695 x 60 / 125 ) / 380 = 87.8%
- Qr = (695 – 45) / 695 = 93.5%
OEE = 90.5% x 87.8% x 93.5% = 74.3%
The OEE is a severe indicator. As soon as a rate is falling, the OEE is strongly impacted.
Performance losses
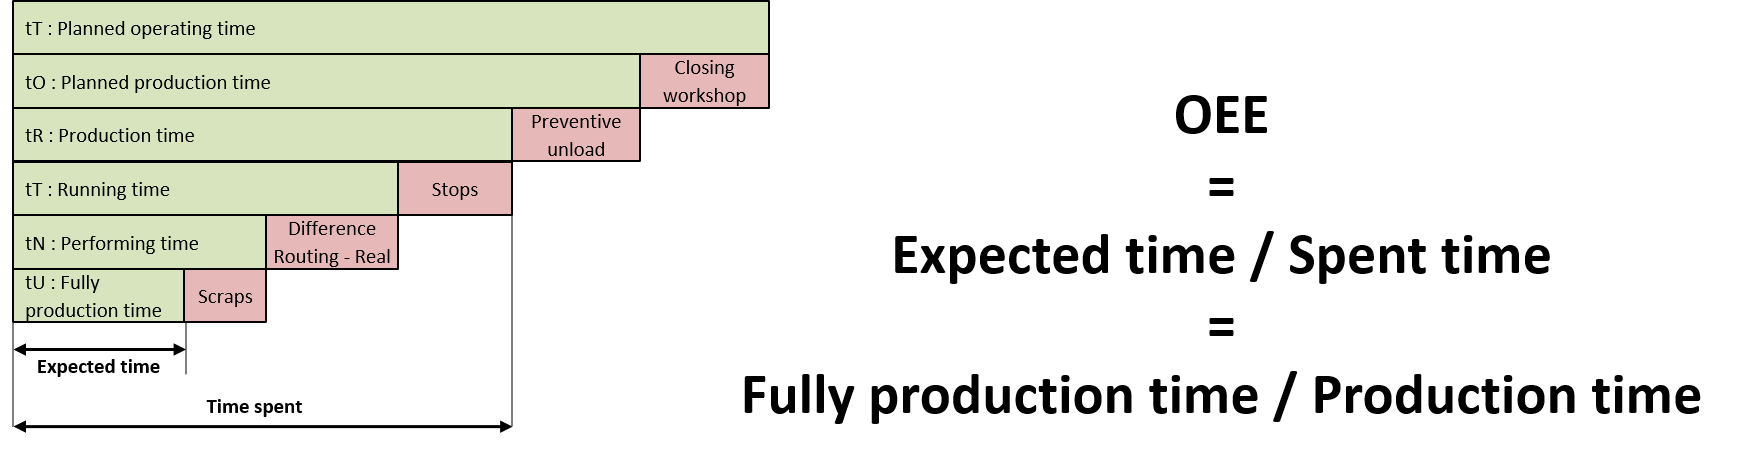
Different time :
| tT | Planned operating time | Total time of the measurement period |
| tO | Planned production time | Possible time of equipment utilization |
| tR | Production time | Schedule operating time |
| tF | Running time | Net operating time |
| tN | Performing time | Routing time allocated to the entire output produced |
| tU | Fully production time | Routing time allocated at the sold production |
6 sources of loss:
Performance losses can be classified into 6 sources.
- Failures: This is all the losses related to equipment failure (electrical, mechanical, automation, …)
- Organisation: Organizational defects are the cause of many performance losses. These may be: lack of staff, lack of material, waiting information, waiting removal of the finished products, …
- Micro stops: These are the short stoppages difficult to quantified. This is often a cause of significant performance loss. They are found in the rate of loss.
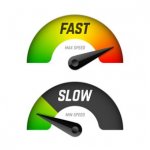
- Slowdown and under speed: This is the difference between the theoretical rate and the actual rate. This is often a result of wrong settings or an optimistic view of the potential rate of equipment.
- Production start: These are losses related to setting for new production order, the test for new pieces, the starting of a new team …
- Quality problems: These are all scraps and re-manufactured parts.
Why follow OEE
OEE is a multi-purpose indicator :
- Results indicator
- Operational indicator
Its analysis, and especially that of its constituent data leads us to highlight the main causes of under performance. From here, we can analyze and implement improvement actions to solve them.
Improving the OEE, brings us to improve productivity and to provide additional capacity.