
What’s efficiency?
- Production measured against a standard, a measurement unit.
- Return on capital employed, an amount invested or placed.
- Someone working efficiency.
- Ratio of energy or other quantity supplied by a power machine consumed by this machine.
In industry, the efficiency will be defined as :
- Quantity produced per unit of time by a labor or equipment
Efficiency = Quantity of good parts manufactured / Number of parts planned
If the installation involves several chained equipment, we speak of cumulative efficiency.
When you plan a charge plan, when you planned an investment, you usually base in efficiency on different machines, but on theoretical efficiency.
And these differ from the actual result!
The measured result differs from the expected results, due to the existence of defects, waste, and cumulative efficiency.
In the case of equipment, the key performance indicator is the OEE.
OEE = Overall Equipment Effectiveness
It tracks the performance of equipment according to 3 components :
- The availability of the machine
- Performance thereof
- Quality that is capable of providing
OEE = Fully production time / Production time
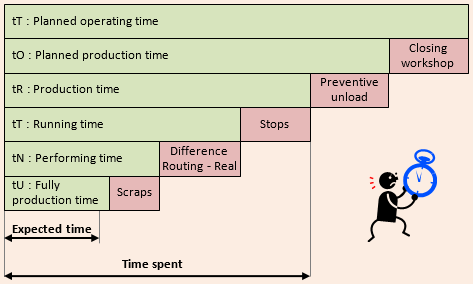
·
Planned operating time = Total time of the measurement period
Planned production time = Possible time of equipment utilization
Production time = Schedule operation time
Running time = Net operating time
Performing time = Rounting time allocated to the entire output produced
Fully production time = Routing time allocated at the sold production
For example, if we consider a machine that :
- Is on a schedule of 8 hours / day
- Is breakdown for 45 minutes
- Is awaiting raw material for 30 minutes
- A lower real rate of 5% compared to routing
- And on which, 1.5% of the parts are defects
At first glance, in many industries, the risks do not seem important. By doing the calculation we have :
- Production time = 8 hours
- Running time = 8 – 0.75 – 0.5 = 6.75 hours
- Performing time = 6.75 x 0.95 = 6.41 hours
- Fully production time = 6.41 x 0.985 = 6.32 hours
OEE : 6.32 / 8 = 0.79
You produce only 79% of good parts in the time!t]
Cumulative effectiveness
·
When the installation includes several machines online, working just in time, the overall performance of the whole will be a cumulative effectiveness.

Overall performance is it equal to the effectiveness of the last position (97%), average effectiveness (90%), or effectiveness of the worst workshop (81%)?
The overall performance is equal to :
92% x 85% x 95% x 81% x 97% = 58% !
Mistake in an investment
Here is a concrete case of investment error. The manager has made a mistake on the performance of the line. He could not keep the commitments and has set up an additional team.

Investment in a sawing – machining – edgebanding panels in a furniture manufacturer.
The manager was left with the following database :
Weekly schedule: 40 hours in 5 days
- Objective 1000 furniture per week
- 5 pieces on average per cabinet – 14 pieces on average per panel
- All parts are squaring / edgebanding on all 4 sides
The supplier has offered a fully integrated equipment and streaming with the following characteristics :
- Sawing: capacity of 10 panels per hour
- Loading panels by forklift
- Machining / Edgebanding : Capacity of 10 pieces per minute or 600 pieces per hour : 600/4 = 150 finished pieces on 4 sides per hour.
- The supplier also indicated that compared to machined products, the efficiency of the machining / edgebanding would be 85%. The performance of the sawing, with a very good reliability could lead us to expect an efficiency of 95%.
The manager has made the following calculation :
- Objective : 5000 pieces per week
- Sawing capacity : 10 x 40 x 14 x 0.95 = 5320 pieces per week : OK
- Machining capacity : 150 x 40 x 0.85 = 5100 pieces per week : OK
It has therefore approved the investment with a planned capacity of 5100 pieces per week.
But the reality was different. The investment could not meet its commitments, even after the ramp-up phase.
1st mistake: Planned production time
- The manager had not incorporated the 20 minutes break on the day! The equipment works only 7h40mn day thus 38.3 hours per week.
- The loss of effectiveness for the 2 devices is (40 – 38.3) / 40 = 4.25%
2nd mistake : Loading saw part
- The study did not consider stopping the flow during the change of raw material. The evolution of the range is that changes are made every 25 panels. This change request 10 minutes. So for the week (400 x 25 ) x 10 = 160 minutes.
- The effectiveness loss for the sawing part, but also for the machining (the line is in one pice flow) : (40 – 37.3) / 40 = 6.75%
3rd mistake : Defects
- He had not been included the fact that 1.5% of the products were defective and had to be machining a second time.
- For the all line it is a loss of effectiveness of 1.5%
The loss of overall capacity of the line :
- 4.25% + 6.75% + 1.5% = 12.5%
Compared to supplier data, the effectieness of each machine becomes :
- Sawing : 95% – 12.5% = 82.5%
- Machining / Edgebanding : 85% – 12.5% = 72.5%
These two machines are online, the overall effectiveness is a cumulative return on the 2 machines:
82.5% x 72.5% = 59.8%
The weekly capacity is only : 150 x 40 x .598 = 3588 pieces equal to 717 cabinets.
An additional shift had to be set up!
Conclusions

To schedule an investment,or to validate a workload capacity, it is imperative to integrate :
The OEE
The cumulative effectiveness
if you don’t want to be with a lower capacity that was planned!